41
Science & Alternative Science / Re: Anthropogenic Climate Change
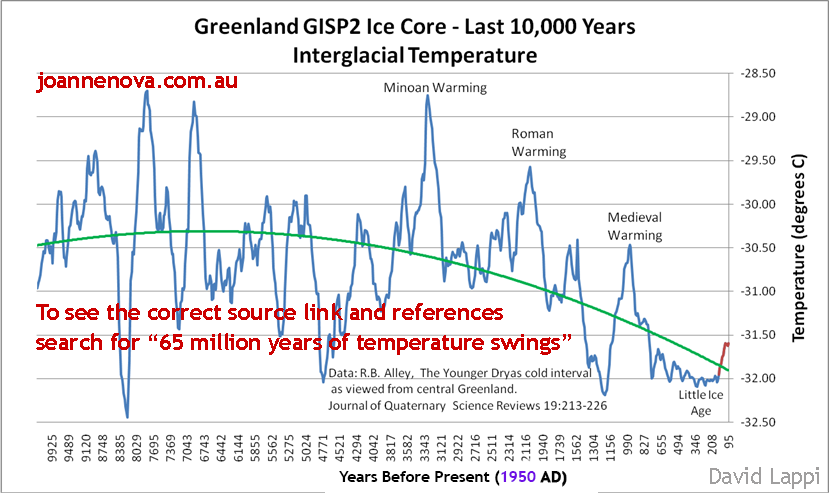
« on: May 02, 2014, 02:05:17 AM »Erm, no. Its nothing like what happened 8300 years ago. do you know how to read a graph?
The tiny red bit on the far right is the bit you are getting your knickers in a twist about. It was 2 degrees warmer than it is now when the Romans wandered about. Animals didn't die, humans weren't made extinct, the ozone didn't fry anyone and the fish didn't all float to the top of the ocean.
But hey, if you want to pay someone tax because of that little red bit at the end, be my guest. Just don't expect me to.
You don't seem to understand that this graph does NOT represent the average world temperatures of the past 100 years. This represents the temperatures of the LOCAL area. Local temperatures will have much more severe variations than the global average, as averages are often less volatile. When you start seeing global changes in average temperatures appear like variations in local areas, you know that there is a serious issue. Here Graph compiling 12 different records from 12 different areas on the planet into a single graph (and hence, an average).

NOTE how individual records vary much more than the average.
NOTE how individual records will OFTEN be warmer than current temperatures.
NOTE how the current temperature is significantly higher than it was at any point in the past 10,000 years.
And please, NOTE the difference between individual data in individual areas, and the averages of all of these data points, and how large changes in individual trends has a significantly different meaning than large changes in the average trends.

 ". Climate changes. Sometimes rapidly and certainly way faster that it is at present. All the animals didn't die out in the last 10,000 years. The trend for temperatures is actually down. If it was getting cooler, we really would have stuff to worry about. It's a relief temperatures are not plunging us further towards another ice-age. Slightly warmer, more hurricanes. But it hasn't got anything to do with me driving my car to work in the morning. Environmental taxes are the new religious taxes. They are trying to get you to believe in something you can't disprove and you are derided as an idiot if you disagree. Only an idiot would swallow such crap. If it costs money, the likelihood is someone has an agenda. Welcome to the climate change industry.


