Show Posts

This section allows you to view all posts made by this member. Note that you can only see posts made in areas you currently have access to.


Messages - Longtitube

Pages: [1] 2 3 ... 12  Next >
1
Quote from: Longtitube
Do you ever read and try to understand the material you cite? The "Seafloor Compliance" study is about deformation of the sea floor under pressure from water waves. You have read the terms "gravity wave", "infragravity wave" and "ultragravity wave" and thought this must be how gravity is detected, but nowhere in that study is measuring acceleration due to gravity even mentioned, nor is a measured gravitational acceleration given.

Yes, I did read it. It says that a gravimeter is reading these "gravity waves" which are measured in Hz, therefore a gravimeter is a seismic detecting device. It also shows that seismic data is interpreted as gravity data. The fundamental error here is in not understanding the principled of what is being detected.

The paper explicitly says the gravimeter is measuring seafloor acceleration:

Quote
We use a LaCoste-Romberg underwater gravimeter to measure seafloor acceleration [Lacoste, 1967; Hildebrand et al., 1990]. This sensor is used as a long-period seismometer on land [Agnew and Berger, 1978] and its useful frequency range is two decades lower than typical ocean bottom seismometers

This seafloor acceleration is compared with water wave pressure. The fundamental error here is not understanding what is being measured.


In the caption we see reference to detecting gravity waves. The "correlative mean" on 30 September is given as 980270189.75 uGal, but we see in the chart that the actual values presented are very low. The values go above and below 0 over time, just like a seismometer  .... we read that absolute gravimeters detect gravity waves and also produce data which looks like a seismic chart.

At last, an explanation. Finally, some reasons behind the erroneous claims of what gravimeters do. Unfortunately, they are based on glaring misunderstandings.

Micro-g Lacoste supply "g9" software with the A10 and FG5-X absolute gravimeters already mentioned, both of which are free-fall instruments dropping a reference object in a vacuum. The software reads data from the gravimeter and also controls its operation.

https://microglacoste.com/download/g9-users-manual/

Quote
How g[9] Processes Gravity Data
This manual assumes the user is familiar with the operation of a Micro-g LaCoste freefall gravimeter. An object is dropped in a vacuum and a laser interferometer is used to accurately track the freefall. The precise timing of optical fringes (which provide distance information) allows the acceleration of gravity, g, to be determined.

The gravimeter times the drop of an object, measures how far it drops and the software calculates the acceleration of gravity from that information – this is repeated many times and the results aggregated. The gravimeter is programmed by the user to perform a prescribed number of drops and these constitute a set of data. The user also programs how many of these sets are performed and these constitute a project. So the user can look at the acceleration for a particular drop, the average acceleration for a set of drops and the average acceleration for all the sets. All the data is preserved. The user can also set the time beween drops and how long to wait between finishing one set and starting another.


This is an example from the g9 software. The project was to make 12 sets of 100 drops, 1200 in all. The most recent drop, drop #100 in the current set, gave a corrected figure of 979647287.69 μgal (microgal). The current set is set #2 and the average corrected figure for the set is 979647288.94 μgal. The project corrected average is 979647289.79 μgal across all the drops measured so far, only 2.1 μgal different from the individual drop shown. That’s 2.1 hundred millionths of a m/s².


https://microglacoste.com/wp-content/uploads/2017/03/Brochure-A10.pdf

This is data recorded in a single set of 120 drops. Each green dot represents a single measurement of gravitational acceleration. The chart also gives the measurement of the latest drop, 979631880.39 μgal which is #120 in the set.


This is data from 16 sets of measurements. Each dot represents the average of the measurements and the vertical line at each dot represents the error bar for the set. (this should look familiar)

Anyone can see the data from the gravimeter is discrete values, not a continuous reading like that from a seismograph:


https://www.researchgate.net/profile/Codrin-Donciu/publication/366458878/figure/fig2/AS:11431281118234473@1675697733420/Typical-seismogram-21.jpg


However, the much more important misunderstanding is in reading the data charts, which are actually scatter charts.

Quote
...we see in the chart that the actual values presented are very low. The values go above and below 0 over time, just like a seismometer.

No, they don't, that type of scatter chart shows the small variations above and below the "correlative mean". A point at -5μgal on the chart is a value of the correlative mean minus 5μgal, a point at +2.2μgal represents the cumulative mean plus 2.2μgal. This type of scatter chart is commonly used in gravimeter-related literature, but if you're not familiar with it, this is an easy mistake to make. Nevertheless, if the measurement were really of very small acceleration values, where then would the "correlative mean" figure come from? You have no idea.

No frequency data is recorded by the gravimeter. No data of seismic vibrations is to be seen in the data. It's obvious that a free-fall gravimeter is not a seismometer, period.

Finally, here's a scatter chart of drop set measurements from a prototype freefall drop gravimeter which unusually uses a conventional scale to show acceleration results. Note the individual points and their error bars:


https://repository.geologyscience.ru/bitstream/handle/123456789/33805/Fall_03.pdf?sequence=1

I hope you now see and understand where the ideas of a "seismic interpretation of gravity" and "vibrating gravity theory" have gone badly wrong. I don't know whether they are your ideas or someone else's, but like UA you would do well to forget them.

2

Quote from: Longtitube
Frankly, the wiki gets this bass ackwards. It also mentions a fictitious "vibrating gravity theory" – where did that derp come from?

That is expressly described in the Wiki. The gravimeter is a seismometer which is detecting "gravity waves". Immediately prior to the Corrections for Latitude section there is the section Gravity Wave Theory

Quote
Gravity Wave Theory

A study titled Seafloor Compliance Observed by Long-Period Pressure and Displacement Measurement uses gravimeters to study the gravity of the ocean. On p.2, para.4 its authors call the gravimeter a long-period seismometer...

Do you ever read and try to understand the material you cite? The "Seafloor Compliance" study is about deformation of the sea floor under pressure from water waves. You have read the terms "gravity wave", "infragravity wave" and "ultragravity wave" and thought this must be how gravity is detected, but nowhere in that study is measuring acceleration due to gravity even mentioned, nor is a measured gravitational acceleration given. The extensive quoting from Wikipedia is irrelevant. Your cherry-picking has yielded ... a zucchini. How disappointing.

And then we have another citation:

... This paper below describes both absolute and relative gravimeters, and then goes on to say that "gravimeters do not give direct measurements of gravity". This means that neither kind of gravimeter is measuring gravity directly.

https://gogn.orkustofnun.is/unu-gtp-sc/UNU-GTP-SC-16-13.pdf

Quote
3.4 Measurements of gravity

There are two kinds of gravity meters. An absolute gravimeter measures the actual value of g by
measuring the speed of a falling mass using a laser beam....
....

3.6 Reduction of data

Gravimeters do not give direct measurements of gravity; rather, a meter reading is taken which is then...

So absolute gravimeters measure the actual value of g, but gravimeters do not give direct measurements of gravity? You're not making sense.

I could produce references and citations about relative and absolute gravimeters, what they measure and how they measure it, but I expect we'll get into a round of "he said, she said" so let's consult the people who ought to know; the gravimeter manufacturers.

One of them is Micro–g LaCoste of Colorado. They manufacture the gPhoneX relative gravimeter, (https://microglacoste.com/product/gphonex-gravimeter/), which is a modern development of the older, purely mechanical LaCoste & Romberg or Worden gravimeters (https://gpg.geosci.xyz/content/gravity/gravity_data.html)  This doesn't directly measure gravitational acceleration, but gives a reading compared to a known gravitational acceleration measurement. The readings are electronic and can be logged on a computer, which is why it "can also be used as an ultra sensitive low frequency seismometer". So that's a gravimeter which can be used as a seismometer.

Then there's their CG-6 Autograv portable survey gravimeter (https://microglacoste.com/product/cg-6-autograv-gravity-meter/) This has a much wider operating range, but can't be used as a seismometer. The SEA III Marine Gravity System is for use on ships (https://microglacoste.com/product/sea-iii-marine-gravity-system/) and the TAGS-7 Dynamic Gravity Meter is for aircraft (https://microglacoste.com/product/tags-7-dynamic-gravity-meter/) and neither of these double as seismometers – it's hard to think how an aircraft-based device could. Interestingly, Micro-g quote the range of variations of g across the world in the SEA III brochure (https://microglacoste.com/wp-content/uploads/2024/11/SEAIII-Brochure_R13.pdf)
Quote
Earth’s gravity varies from 978 to 983 Gals at sea level (full change of 5 Gal)

How do they know that? Because for over 80 years they have been making the instruments that measured it!

Micro–g also build the A10 Portable Absolute Gravity Meter (https://microglacoste.com/product/a10-outdoor-absolute-gravimeter/) and the FG-5X Absolute Gravity Meter (https://microglacoste.com/product/fg5-x-absolute-gravimeter/) which both use a dropping mass to measure gravitational acceleration directly. The FG-5X is the standard by which all the rest are judged and by which all the rest are calibrated, but these two are where you have got tangled up with the daft idea these machines monitor the bottom mirror for tiny vibrations to measure gravity.

From the A10 brochure:

Quote
The A10 operates by using a free-fall method. An object is dropped inside a vacuum chamber and its position is monitored very accurately using a laser interferometer. In 2004, the BIPM (Bureau International de Poids et Mesures) proclaimed the ballistic freefall method as an official primary method for measuring gravity.
The free-fall trajectory of the dropped object is referenced to a very stable active-spring system called a “Superspring”. The Superspring provides seismic-isolation for the reference optic to improve the noise performance of the A10.
The optical fringes generated in the interferometer provide a very accurate distance measurement system that can be traced to absolute wavelength standards. Very accurate and precise timing of the occurrence of these optical fringes is done using an atomic rubidium clock that is also referenced to absolute standards.
The measurement is directly tied to international standards, and this is what makes the A10 an absolute gravimeter. By basing the measurement on these standards, the system is inherently calibrated and will neither drift nor tare over time. (https://microglacoste.com/wp-content/uploads/2017/03/Brochure-A10.pdf)

The same is true for the FG-5X. The bottom mirror is isolated from vibrations of the meter body by the Superspring mechanism, so gravitational acceleration is being measured by very precise timing of the fall of the top mirror in the vacuum and only by that means.

I think the person who originally came up with Universal Acceleration was trolling you and the wiki has swallowed that troll – hook, line and sinker. You would do well to forget the whole idea, which carries the seeds of its own destruction in the variations in gravitational acceleration across the world, which would tear an upwardly accelerating Earth apart.

3
The Wiki covers that. See the section Corrections for Latitude.

The wiki covers this? Covers it in muddled thinking and errors, and anyone wanting to learn something about gravimetry and gravimeters should look elsewhere – even Wikipedia is a better choice.

Where to start? From the wiki, as quoted above:–

Quote
If the objective of gravity surveys is merely to look for deviations from a round earth reference model with the vibrating gravity theory, then the final computed number in meters per second squared would becomes meaningless for the purpose of discussion. Any modifications to the reference values are constructed on an entirely theoretical basis.

The above page tells us that there is a theoretical model and that the goal of gravity surveys is to modify that model.

Frankly, the wiki gets this bass ackwards. It also mentions a fictitious "vibrating gravity theory" – where did that derp come from?

First, the theoretical model, which has an equation (cited above) giving the theoretical value of gravitational acceleration at the geoid level for anywhere on Earth, accurate to one tenth of a mgal (milligal) – that's 0.00001 m/s². There is also a more elaborate equation which gives results accurate to a ten-thousandth of a mgal (0.0000001 m/s² – a thousand times more accurate) if needed. Pick your location, plug the latitude into the equation and you get a theoretical value for acceleration at geoid level (generally, but not always, equal to sea level).

Next, the gravity survey. Surveyors measure the acceleration directly with an absolute gravimeter, or the difference from a known, accurate measurement of gravitational acceleration with a relative gravimeter. Then there are corrections applied to the measured value, not the theoretical value. The theoretical value is for geoid level, but an absolute gravimeter measurement at Emigrant Gap, CA on Interstate 80, is at 1582m or 5190ft above sea level. Gravity does reduce with height, so a correction to give the expected value at geoid level is applied to the measurement – this is the Free Air correction. There is also a great deal of rock in those 1582m above the geoid and this is also corrected for – this is the Bouguer correction.

Let's say the surveyors are instead using a relative gravimeter and the known accurate measurement they are comparing with is at Sacramento, CA. A Latitude correction is applied to the Sacramento figure to account for the 42 minutes and 55 seconds difference in latitude between Sacramento and Emigrant Gap, because gravity does vary with latitude.

Note well – no corrections are applied to the theoretical value – all corrections are applied to the measured data. All these corrections are to give a measurement for gravitational acceleration corrected to geoid level, as if the surveyors were actually measuring at the theoretical geoid level, so comparisons can be made from other places, also corrected to the geoid level, making sure surveyors are comparing apples with apples, not coconuts with bananas.

The corrected, measured values are then compared with the theoretical values and the difference, if any, noted – this difference is the gravitational anomaly. Maps of the gravitational anomaly over a given area are used for many purposes, including oil and mineral prospecting, and are a valuable tool. The Nash dome in Texas was the first oil discovery made using an early type of gravimeter (in the 1920s) and many have followed since.

What's missing from the wiki, or any of the examples you've mentioned, are numbers: actual data and actual calculations. Do your vaguely expressed doubts stand up to examination? It's time to do some more calculations using a more reliable introductory guide.

https://gpg.geosci.xyz/content/gravity/gravity_introduction.html

The data reduction formulas are given on https://gpg.geosci.xyz/content/gravity/gravity_data.html

Let's use the Emigrant Gap site to start with. I'll assume the geoid coincides with sea level for these calculations and I'll use the suggested "crustal" density figure for Bouguer calculations. The Free Air correction is 0.3086 x 1582 = 488.2mgal, which is added to the measured figure. The Bouguer correction is 0.04191 x 1582 x 2.67 = 177.0mgal which is subtracted from the measured figure. The net adjustment is therefore 488.2 - 177.0 = +311.2mgal and would be applied to a measurement made by an absolute gravimeter.

If the surveyor was instead using a relative gravimeter, the latitude correction would also be made for the difference in latitude between Sacramento and Emigrant Gap, which is 42.9 nautical miles or 79.5km. Latitude of Sacramento is 38° 34' 54"N and Emigrant Gap is 39° 17' 49"N, so I'll use 39° as an average. Latitude correction is therefore 0.811 x sin(2x39) x 79.5 = 63.1mgal and this is subtracted from the measurement to directly compare with the Sacramento figure. The net adjustment for a relative gravimeter is therefore +311.2 - 63.1 = +248.1mgal.

The acceleration figure I found for Sacramento was 9.80033m/s², which is 980.033 Gal, or 980,033mgal, but an adjustment of 311.2 mgal (or 248.1mgal) is hardly significant compared to the headline figure, or the figures cited from around the world, but we'll have a look at the extremes of that range (9.772 to 9.829m/s²) to make sure. These were all made with absolute gravimeters, so we can ignore latitude corrections.

Quito in Ecuador is at 2850m above sea level. Free air correction is 0.3086 x 2850 = 879.5mgal. Bouguer correction is 0.04191 x 2850 x 2.67 = 318.9mgal. The net adjustment is +879.5 - 318.9 = +560.5mgal. The cited acceleration figure is 9.772 m/s², which is 977,200 mgal. 560.5mgal are pretty small beer next to the headline figure.

Thule Air Base in Greenland, now known as Pituffik Space Base, is at 76.5m above sea level. Free air correction is 0.3086 x 76.5 = 23.6mgal. Bouguer correction is 0.04191 x 76.5 x 2.67 = 8.56. Net correction is +23.6 - 8.56 = +15.04mgal. This is tiny in comparison to the cited 9.829 m/s² or 982,900mgal.

The cited gravitational acceleration figures are so many orders of magnitude larger than the corrections applied to their direct measurement that there is no justifiable hope the corrections might account for the differences across the world. An upwardly accelerating flat earth would still self-destruct in less than half a day.

4
TL/DR: measured acceleration values of between 9.829 m/s² (Thule, northern Greenland) and 9.772 m/s² (Quito, Ecuador) are documented: these are 0.3% larger and 0.29% smaller than the aforementioned 9.8 metres/second². Acceleration is generally larger nearer the poles, smaller nearer the equator.

https://www.researchgate.net/publication/276278343_Absolute_gravity_measurements_in_South_Africa#pf6
https://library.arcticportal.org/2513/1/A20130416.pdf
https://www.sirgas.org/fileadmin/docs/Boletines/Bol24/45_Guaimaraes_et_al_2019_Absolute_gravimetry_SouthAmerica.pdf
https://apps.dtic.mil/sti/pdfs/ADA099017.pdf
https://agupubs.onlinelibrary.wiley.com/doi/epdf/10.1029/2000GL012438
https://www.researchgate.net/publication/350145419_Twelve_Years_of_High_Frequency_Absolute_Gravity_Measurements_at_the_UK%27s_Space_Geodesy_Facility_Systematic_Signals_and_Comparison_with_SLR_Heights/fulltext/609da3ca299bf147699628f2/Twelve-Years-of-High-Frequency-Absolute-Gravity-Measurements-at-the-UKs-Space-Geodesy-Facility-Systematic-Signals-and-Comparison-with-SLR-Heights.pdf
https://geodaesie.info/images/zfv/133-jahrgang-2008/downloads/zfv_2008_3_Timmen_et-al.pdf
https://academic.oup.com/gji/article/217/2/1141/5304614
https://www.researchgate.net/publication/232822567_Absolute_gravity_values_in_Norway
https://www.academia.edu/4418215/Absolute_gravity_measurements_in_India_and_Antarctica
https://backend.orbit.dtu.dk/ws/portalfiles/portal/89119479/PHD_JEMNI_1_.pdf

Acceleration also varies within countries. Within the US, documented acceleration figures vary from 9.788 (Texas) to 9.805 (Missouri) to 9.819 m/s² (Alaska).  Norway ranges from 9.818 (Stavanger) to 9.827 m/s² (Honningsvåg). Antarctica records values of 9.826 (twice) and 9.825m/s².

This is talking about gravimeters. We have a page on this here: https://wiki.tfes.org/Gravimetry

Considering that there are seismometers which have a "gravimeter mode" and there are quotes that a gravimeter is really a seismometer, it's clear that there is something wrong with your interpretation on how this device is measuring gravity. There are also maps showing that the gravitational anomalies across the earth are associated with the seismic zones, further questioning what this device is actually measuring.


I have read the wiki page on gravimeters, repeatedly, and understand how it suggests a relative gravimeter can be compared with a seismometer. However, I wonder if you actually read my post, because all my citations are from absolute gravimeters:

Experimental measurements of acceleration towards the ground by an object falling in a vacuum have been done for many years and at many locations. The OP will insist that these are actually measurements of the earth accelerating towards the object, but it's irrelevant – relative to the object or relative to the Earth, there is undeniable acceleration of one towards the other and this has been measured with great precision.


If you can explain how an object accelerating towards the ground in a vacuum can detect seismic signals I would be really surprised, because the wiki page doesn't explain it. All the measurements in the cited references are measuring the acceleration of a mass, in a vacuum, towards the ground.

If you can also explain how gravitational anomalies make these acceleration measurements vary both above and below the expected value I should be equally surprised, because the wiki doesn't explain how that might be so. More damningly, the northwest coast of Greenland and Ecuador are the furthest variations above and below, respectively, the expected value. The wiki has a map of gravitational anomalies above and below expected, yet both the Greenland and Ecuador values are in areas of positive anomaly on that map, not one in positive anomaly and the other negative. This is inconsistent with the wiki claim.

Finally, the variations cited in the wiki map https://wiki.tfes.org/Gravimetry#Seismic_Map_Similarities are of up to plus or minus 70 mGal. One mGal is one thousandth of a Gal, one Gal is 1 cm/s² or one hundredth of a metre/s², so one mGal is one hundred thousandth of a metre/s² or 0.00001m/s². 70mGal is therefore 0.0007 m/s² and is too small to register in the quoted 3-decimal-place measurements of 9.827 to 9.772 m/s².

The cited differences in acceleration of an object in a vacuum are therefore too large to be explained by the wiki's quibbling. The upwards-accelerating flat earth would still tear itself to pieces in less than half a day.

5
Things do not "fall" to the ground. The so-called "falling" is nothing more than the result of the Earth accelerating upwards at 9.8 m/s², as evidenced by direct observations and experiments...

...The evidence overwhelmingly supports the upwards acceleration of the surface as the more direct explanation of physical reality

Ah yes, the evidence nobody seems able to produce, so I did my own research. Experimental measurements of acceleration towards the ground by an object falling in a vacuum have been done for many years and at many locations. The OP will insist that these are actually measurements of the earth accelerating towards the object, but it's irrelevant – relative to the object or relative to the Earth, there is undeniable acceleration of one towards the other and this has been measured with great precision.

TL/DR: measured acceleration values of between 9.829 m/s² (Thule, northern Greenland) and 9.772 m/s² (Quito, Ecuador) are documented: these are 0.3% larger and 0.29% smaller than the aforementioned 9.8 metres/second². Acceleration is generally larger nearer the poles, smaller nearer the equator.

https://www.researchgate.net/publication/276278343_Absolute_gravity_measurements_in_South_Africa#pf6
https://library.arcticportal.org/2513/1/A20130416.pdf
https://www.sirgas.org/fileadmin/docs/Boletines/Bol24/45_Guaimaraes_et_al_2019_Absolute_gravimetry_SouthAmerica.pdf
https://apps.dtic.mil/sti/pdfs/ADA099017.pdf
https://agupubs.onlinelibrary.wiley.com/doi/epdf/10.1029/2000GL012438
https://www.researchgate.net/publication/350145419_Twelve_Years_of_High_Frequency_Absolute_Gravity_Measurements_at_the_UK%27s_Space_Geodesy_Facility_Systematic_Signals_and_Comparison_with_SLR_Heights/fulltext/609da3ca299bf147699628f2/Twelve-Years-of-High-Frequency-Absolute-Gravity-Measurements-at-the-UKs-Space-Geodesy-Facility-Systematic-Signals-and-Comparison-with-SLR-Heights.pdf
https://geodaesie.info/images/zfv/133-jahrgang-2008/downloads/zfv_2008_3_Timmen_et-al.pdf
https://academic.oup.com/gji/article/217/2/1141/5304614
https://www.researchgate.net/publication/232822567_Absolute_gravity_values_in_Norway
https://www.academia.edu/4418215/Absolute_gravity_measurements_in_India_and_Antarctica
https://backend.orbit.dtu.dk/ws/portalfiles/portal/89119479/PHD_JEMNI_1_.pdf

Acceleration also varies within countries. Within the US, documented acceleration figures vary from 9.788 (Texas) to 9.805 (Missouri) to 9.819 m/s² (Alaska).  Norway ranges from 9.818 (Stavanger) to 9.827 m/s² (Honningsvåg). Antarctica records values of 9.826 (twice) and 9.825m/s².

I have rounded the acceleration values measured to three decimal places in all examples.

These variations in acceleration pose a dreadful problem to UA, because they indicate a flat, upwardly accelerating Earth is not accelerating uniformly. The variations in acceleration from the aforementioned 9.8m/s² are only +0.3%  to -0.29%, but a little schoolboy physics shows this is catastrophic in practice.

We will start from a stationary flat earth to simplify the calculations. For acceleration a, the distance travelled (from a standing start) in time t is given by:

                    distance, d = a/2 x t²                              d in metres, a in m/s², t in seconds.

In one minute (60 seconds), an object accelerating at 9.772 m/s² will travel (9.772/2) x 60² = 17,589.6m. At 9.829m/s² the distance travelled is 17,692.2m. 102.6m difference between largest and smallest distances isn't much across the entirety of a flat earth.

In 10 minutes (600 seconds) the results vary from a minimum of (9.772/2) x 600² = 1,758,960m to a maximum of (9.829/2) x 600² = 1,769,220m, a difference of 10,260m. In just 9 minutes the difference has risen a hundredfold.

In 1 hour (3,600s) the results vary from (9.772/2) x 3600² = 63,322,560m to (9.829/2) x 3600² = 63,691,920m. The difference is now 369,360m or 369.36 kilometres.

In 12 hours (43,200s) we get (9.772/2) x 43200² = 9,118,448,640m at a minimum and (9.829/2) x 43200² = 9,171,636,480m maximum distance travelled. The difference is 53,187,840m.

It has taken 12 hours for areas of a flat earth accelerating upwards at experimentally measured rates to rise by vertical distances differing by up to 53,187.84 kilometres, which is more than five times the distance from the north pole to the equator. If it were even possible for a flat earth to distort by this much, it would no longer be flat, the oceans would be pooling around the tropics and the mountain some believe is at the north pole would in fact be the entire Arctic region. However, the world is not made of pulling taffy, able to stretch at will, and the only sane conclusion is that a flat earth would have been pulled apart by the stresses and reduced to rubble less than 12 hours after starting to accelerate.

The very notion this is the idea Brian Cox is endorsing is ridiculous.

6
Remarkable. I'll be blunt then, which experiments on Earth's surface tell us it's the Earth physically accelerating upwards, not gravity pulling us towards Earth?

It's mostly all the stuff you have already heard about.

- Light redshifts when pointed at a ceiling. ...
- The perceived information from a clock speeds up as the clock increases in height above you....
- Bodies and particles of different masses fall together...
- Bodies are weightless as they fall...

The reason these phenomena are being pointed out with interest by physicists in the relativity articles is because it's not something Newtonian Gravity adequately predicts.

You are assuming I have objections to General Relativity as an explanation of gravity – incorrect, I have no particular difficulties with it, despite the mathematical challenges. However, none of the phenomena you have listed, or the many others referenced in the wiki, demonstrate that Earth is physically accelerating upwards. This is entirely consistent with the Equivalence Principle, that a person standing inside a closed box on Earth would be unable to distinguish his circumstances from being instead in a box in empty space being accelerated at 9.8ms-2. You seem to think GR means a flat earth is forever physically accelerating upwards, but GR doesn't make that claim. It instead says that with a suitable reference frame, Earth can be considered as accelerating towards the apple. It's the same story Einstein repeatedly uses, that of the passenger on the train versus the observer on the railway embankment: to the passenger, the embankment can be regarded as moving relative to the train. He nowhere says the embankment must be moving and the train at rest.

Quote
If we confine the application of the theory to the case where the gravitational fields can be regarded as being weak, and in which all masses move with respect to the co-ordinate system with velocities which are small compared with the velocity of light, we then obtain as a first approximation the Newtonian theory. Albert Einstein

You'll find that quotation in the book I referred to above. Should you know of an experiment which clearly indicates Earth is physically accelerating upwards, I'd be delighted to hear of it.

7
Direct experiments on the earth's surface tell us that the earth is accelerating upwards.

The OP and the relevant wiki articles all frequently and approvingly refer to the Equivalence Principle when discussing UA, but the EP states that acceleration of the Earth and gravitational acceleration are experimentally indistinguishable. How then can experiments on the Earth’s surface tell us that it’s the Earth physically accelerating upwards, not gravity pulling us towards Earth?

The OP has some explaining to do before rubbishing general relativity.

The problem is that you read a sentence about gravity from physicists and think that it's talking about Newtonian Gravity because that is the topic in dispute here. Those the same physicists also say that General Relativity succeeded Newtonian Gravity long ago. The gravity they are talking about is General Relativity. They are saying that upwards acceleration of the earth's surface and the General Relativity theory of gravity are experimentally indistinguishable in laboratory experiments. You will also find that those sentences of indistinguishability appear in articles about the history and advantages of Einsteinian gravity, giving additional context to which gravity it is talking about.

Remarkable. I'll be blunt then, which experiments on Earth's surface tell us it's the Earth physically accelerating upwards, not gravity pulling us towards Earth?

Your difficulties with Brian Cox are at least partly accounted for by his mischievous nature – in the original video you referenced, he's already mocked people calling him a paid NASA shill by claiming that's how he can afford to stay in the Raffles Hotel, Singapore, lol. General Relativity builds on the work of Special Relativity by developing a means of relating different frames of reference where acceleration and/or rotation are involved. The mathematical methods of accomplishing this are indeed very high-level, but they allow us to consider a reference frame with the Earth moving upwards through space if that suits the case we want to analyse. Cox and others enjoy provoking the viewer's interest by citing just such a case, as well as having a dig at those who believe the Earth is physically accelerating upwards. Protesting about "metaphysical mathematics" only shows no appreciation of the breadth and scope of the subject – it's beyond my pay grade too, but you might at least try. On the other hand, UA is easily dismantled with some experimental evidence and schoolboy physics.

Should anyone's interest be piqued, Einstein himself wrote a more accessible book on both SR and GR. https://www.ibiblio.org/ebooks/Einstein/Einstein_Relativity.pdf

8
Direct experiments on the earth's surface tell us that the earth is accelerating upwards.

The OP and the relevant wiki articles all frequently and approvingly refer to the Equivalence Principle when discussing UA, but the EP states that acceleration of the Earth and gravitational acceleration are experimentally indistinguishable. How then can experiments on the Earth’s surface tell us that it’s the Earth physically accelerating upwards, not gravity pulling us towards Earth?

The OP has some explaining to do before rubbishing general relativity.

9
Flat Earth Community / Re: Your data is at risk if you use this app
« on: March 12, 2025, 08:28:28 AM »
Thanks for your efforts Pete, it’s appreciated. I don’t use the app myself (why would I?) but I thought it entirely possible some actual users would be among those who read these forums and ought to know the pitfalls.

10
Flat Earth Community / Re: Your data is at risk if you use this app
« on: March 03, 2025, 10:11:18 PM »
You might save some time by starting with a recent very public description of the security shortcomings:

https://www.youtube.com/watch?v=grjDlOIdf5Q&t=152s

11
Flat Earth Community / Your data is at risk if you use this app
« on: February 27, 2025, 08:31:55 PM »


If you recognise the above screenshot as coming from an app you use, beware.

This is from Flat Earth Dave (DITRH)'s Flat Earth Sun Moon & Zodiac Clock app and any data of yours it stores – email, location, password, age etc is stored as safely as in a waste paper basket. No kidding.

Anyone with some knowledge of software construction can download the app, read from it where your data is stored and go read it for themselves. You protected your data with a password? That doesn't help – your password is stored in plain text, readable by anyone who can read.

I know this site doesn't look on MC Toon with a friendly eye, but he's done you a favour by publicising this app's complete lack of security. If Joe Soap can read your location and personal information – easily – what could be done with that information?

Finally, for those here who do understand more than most about computer database files, here is a description (from someone who has seen the files) of some of the shortcomings:


12
Flat Earth Investigations / Re: Solar Eclipse of Aug 12, 2026
« on: February 05, 2025, 09:40:15 PM »
It still has the same problem. If the Moon's shadow is traveling at that steep of an angle then there should be steep Southward or Northward vertical shadow movement in all eclipse shadow paths. Yet we see many with relatively horizontal Eastwards paths for the same duration.

I get that you don't understand this, but I also don't get your thinking there should be "steep Southward or Northward vertical shadow movement in all eclipse shadow paths." Spoiler alert: the marked southern or northern movements occur when the eclipse shadow lands on the northern or southern polar latitudes. For your better understanding, have a look at the global eclipse animations at EclipseWise: they have dozens, if not hundreds, starting from AD2001 and running to at least AD2100 and they make sense of the convoluted paths on Mercator maps that have you baffled. You will find all the examples you've already referred to, so knock yourself out.

https://eclipsewise.com/solar/SEdecade/SEdecade2021.html      (this is for 2021-2030)

13
Flat Earth Investigations / Re: Solar Eclipse of Aug 12, 2026
« on: January 29, 2025, 09:23:42 PM »
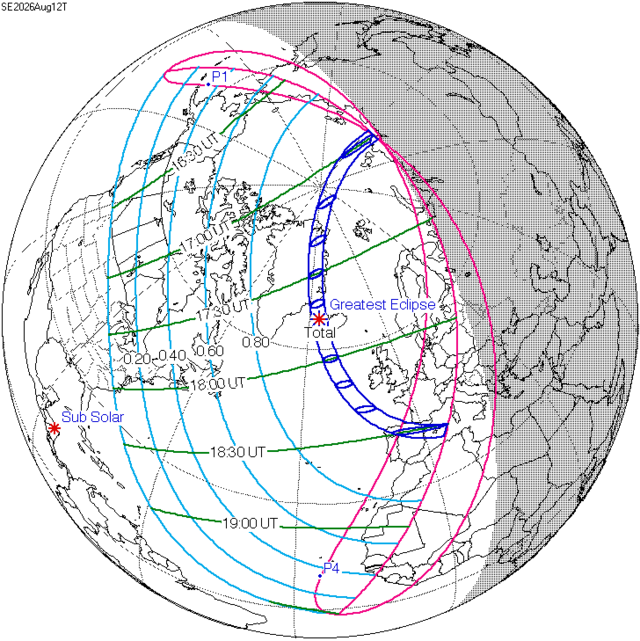
As has been said, these things are complex, so here's an interesting animation of the August 12, 2026 eclipse looking at the globe from the Moon.  (https://eclipsewise.com/solar/SEprime/2001-2100/SE2026Aug12Tprime.html)


The Moon's shadow is seen both descending North to South and moving West to East, consistent with its observed behaviour at a descending node. The small black shadow of totality (full eclipse) moves at a consistent speed in a straight line across the field of view during the roughly 1½ hrs of its track over the globe. The larger, slightly shaded circle shows where a partial eclipse will be seen. Projecting this eclipse path animation on to a Mercator map of the world will show the contorted path I showed on page 1 of this thread, and the OP's illustration. Perhaps this will help explain his difficulty.

14
Flat Earth Investigations / Re: Solar Eclipse of Aug 12, 2026
« on: January 22, 2025, 09:55:40 PM »
You are talking about this North-South movement from this University of Arizona diagram:


The above diagram is not to scale, but we can compute with the correct values. Starting from the New Moon position in the diagram lets calculate how fast the Moon is descending Southward.

To get the dimensions of one of the sides of the triangle to the right of the Earth in the above image we can fill out a Triangle Calculator with 5 degrees, 238900 (avg distance from earth to moon in miles), and 90 degrees.


This creates the following result:


The shortest side a, the Opposite Side, is 20,201.13241 miles

We take this value and double it to get the Opposite Side of the other triangle that would be on the lower left of the diagram scene when it approaches Full Moon.

20,201.13241 miles x 2 = 40402.26482 Miles

There are 29.5306 days in a lunar month, the time it takes to get from New Moon to the next New Moon. This should be divided by two to get the time from New Moon to Full Moon

29.5306 / 2 = 14.7653 days in half a lunar month

Half a lunar month in hours is 354.3672 Hours

Now, to get the speed the Moon is traveling Southward we can divide distance by time:

40402.26482 / 354.3672 = 114.0124 Miles Per Hour

The total time of the Aug 12, 2026 total eclipse shadow can be found on https://www.timeanddate.com/eclipse/solar/2026-august-12

    First location to see the full eclipse begin   Aug 12 at 16:58:09 (UTC)
    Last location to see the full eclipse end   Aug 12 at 18:34:07 (UTC)

This is only about 1 hour and a half hours, and according to the maps the total eclipse shadow is traveling a distance equivalent to about the diameter of the Arctic Circle. Unless you are proposing that that North-South distance traveled is only about 171 miles, this does not make sense.

The shadow should obviously be moving Southward far slower.

I applaud your trying some actual calculations for this, but must point out some shortcomings in your reasoning.

Although you've calculated vertical distance (relative to the ecliptic) between new moon and full moon, you then divide this distance by the time between these events to give an average vertical speed for this movement. This suggests the Moon moves at this speed between new and full moon, but this is unrealistic and implies the Moon's vertical speed would immediately reverse at the full moon to the same speed in the opposite direction. This sudden reversal in vertical speed would be immediately visible to astronomic observers, but no such change is seen: it would be a big talking point for anyone interested in lunar astronomy. The Moon moves in an elliptical orbit around Earth, so vertical speed (relative to the ecliptic) will increase from nil at the new moon to a maximum as it crosses the ecliptic, decrease to nil as the full moon is reached, increase to maximum in the opposite direction as it re-crosses the ecliptic and decrease to nil as the next new moon is reached. The acceleration and deceleration won't be linear either, as a consequence of the elliptical orbit. Solar eclipses occur when the Moon is on or very close to the ecliptic, so the Moon will be moving at or near its maximum vertical speed.

Applying the calculated vertical speed to the globe presents further problems: a globe is not a flat wall and 100 vertical miles (relative to the ecliptic) will be almost exactly 100 surface miles on Earth near the Equator, but more than 1100 surface miles, for example, at latitude 85°N. This shows in the gif when the shadow is crossing the Arctic Ocean much faster than in mid-Atlantic.

Furthermore, the animated gif shows that the moon shadow is running off to the eastern rim of daylight over the Mediterranean as the eclipse ends, so the horizontal surface speed (relative to the ecliptic) on the globe is much greater than at mid-eclipse.

Much more work to do, sorry.

15
Flat Earth Investigations / Re: Solar Eclipse of Aug 12, 2026
« on: January 18, 2025, 08:59:10 PM »
As we've discussed over the last 15+ years, the eclipse predictions are based on patterns rather than an actual geometric model. The denialists are defeated on that point every time it is discussed. Since the predictions are not based on a geometric RE model it creates doubt in the mind, and further evidence that the eclipse predictions do not follow that model fosters cynicism.

Take a look at the Solar Eclipse of Aug 12, 2026, which will pass over our favorite future US protectorate:


Notice anything odd? During the eclipse the shadow of the Moon will be moving vertically in a North-South direction. This is quite odd, considering that the Moon is said to travel around the Earth in a East-West direction (or West-East, if you want to argue about rotating earth semantics).

The best excuse you can expect for this typically amounts to "you haven't considered that the Earth is tilted", without expanding further. But any possibility of a coherent explanation can be easily dismissed, since in the Round Earth Theory the Moon is traveling in the same plane of the Sun, and only misaligned by 5 degrees. They are essentially on the same plane. The tilted Earth effect must also occur with the Sun. Reviewing the path that the Sun makes over the Earth, it is difficult to see how the Moon's shadow can move in this direction.

Is that really the most outlandish image of the predicted eclipse path you could find? This took moments to find:


And since the Wikipedia image is public domain, why not show it too?


This one shows the predicted eclipse path on the globe, making it altogether more understandable: the eclipse is forecast to begin off the northern coast of Siberia and finish over the western Mediterranean. Remembering how accurate the predictions were of an eclipse in 1999, also in August, and how I was able, having known for 20 years, to travel just 20 miles to see it completely black out the sun, it would be useful to know how the Saros cycle patterns predict the precise timing and exact location of an eclipse so accurately. It would also help your case to plot the 2026 path on a flat earth map instead of your bad Mercator projection of the globe – I mean, Greenland looks even bigger than Canada and Svalbard at least as big, if not actually bigger than the UK: the ratios in each case are roughly 1:4, oops.

If you're going to poke holes in eclipse calculations, you're going to need more than that.

16
Flat Earth Community / Re: The Final Experiment
« on: December 20, 2024, 10:38:47 PM »
It should be fun to watch what develops, here and elsewhere.

You may be in the wrong community then. It is a different Flat Earth community which says the Midnight Sun is impossible. This community has always accepted the Midnight Sun in its models and portrays several mechanisms in its materials, which relay that the Antarctic midnight sun has been in Flat Earth models since at least the 1920's. Even in the classic Monopole model, the magnifying dome demonstration for the seasons appears to make a midnight sun.

It's also plausible that our official celestial model for Flat Earth, the  EA Model, could be extended predict a midnight sun. If the light of the sun actually takes the shape of something similar to the closed loops of magnetic field flux lines, it could be that the earth is interrupting the natural path of the Sun's light and that the rays on a larger scale could loop around and appear to be coming from the opposite direction to a distant observer.

If we take one of the upwardly bending light diagrams in the link above and simply extend the loop of one of the rays which intersect with the earth, it loops around and appears to be coming from an opposite direction.


This isn't new, and I have my own questions about the particulars of how this dipole shape would appear, but the above appears to demonstrate that a midnight Sun is not an impossibility in current constructs.

Thank you for the sketch, but it doesn't appear to have uploaded completely – there are no annotations to explain what we're looking at, where an observer would be or where the sun is.

17
Flat Earth Community / Re: The Final Experiment
« on: December 18, 2024, 09:29:23 PM »
It's been fascinating watching the footage from Antarctica: now that the trip has ended there should be more bandwidth-hungry content to enjoy or fulminate at. What's also fascinating is the reactions from both sides, globe and FE, to the expedition, to the videos, to the experiments, to the very idea of going to Antarctica for real. I was interested in Jeran's remarks in his last livestream before leaving for Punta Arenas to head home – he doesn't seem to have enjoyed Antarctica as a destination. There's an undeniable bit of homesickness too.

I've seen a lot in people's comments to gasp, shake head at or just laugh. This thread has its place in the panoply of reactions and opinions from all parties: not as funny as I've seen, not such full-strength seething and coping, and nowhere near as outlandish as some, but a fairly interesting sample all the same. It should be fun to watch what develops, here and elsewhere.

18
Flat Earth Community / Re: The Final Experiment
« on: December 16, 2024, 10:02:05 PM »
Well whaddya know, they actually got to Antarctica and apparently no-one has been scammed. Lots of interesting footage of the Union Glacier site and the sun blazing away 24 hours a day from both globe and FE participants. Some people took "do your own research" seriously and it's been fascinating.

19
When we look closer at the details we just see anomalies and that things are not really in accordance with what is generally claimed at face value.

Indeed: the OP (and your next post) rewards closer study.
 
In this sort or race for the "around the world sailing record", the goal wasn't necessarily to make a perfect circumference around the globe for obvious reasons, and is really the fastest time someone could sail a distance of 21,600 nautical miles. Francis Joyon and François Gabart made this path:

https://goldengloberace.com/the-route/


This path takes place further northwards near the continents. The total course is 30,000 miles, but they only count the best time to 21,600 nautical miles for the specific record, since this is the circumference of the RE in RE Theory.

Incorrect.
When Joyon and Gabart and his crew (edit: Gabart took the solo record on a different multihull) lifted the record for sailing around the world, they also won the Jules Verne Trophy and it is a condition of that trophy that record setters begin by crossing a line between Créac’h lighthouse on Ushant Island, off the French north west coast and the Lizard lighthouse off the English south coast. Their time is to sail around the world leaving the Capes of Good Hope, Leeuwin and Horn to port (on the left) and re-cross that same line in the western English Channel, not to complete 21,600 miles. There are no restrictions on the type of yacht used, as long as it is capable of sailing around the world unaided.

That map shows the track of the Golden Globe 2022 race, a race using traditional yachts in the style of Sir Francis Chichester's famous Gipsy Moth IV, which generally takes 9 months to complete and high-tech aids like GPS are forbidden, it's sextants and chronometers for navigation. It starts and finishes at Les Sables-d'Olonne on the French west coast. about 180 miles from Ushant, and there are also mandatory calling points where each yacht stops in close sight of land for 90 minutes.

It looks like you guys are claiming that she had a bad boat. According to Guinness World Records Lisa Blair holds the record for "Fastest circumnavigation of Antarctica by sailboat". She did it in 92 days 18 hours 21 minutes 22 seconds. We know that hundreds of people are trying to beat world records, and there are even yearly races around Antarctica (which we are often pointed to, but the details are rarely discussed). This represents the best boat, so your arguments are pretty invalid.

Joyon's and Gabart's IDEC SPORT (formerly IDEC 3) is 31.5m long, Lisa Blair's Climate Action Now is half that length. IDEC SPORT carries far more sail than Climate Action Now and uses foils which lift the trimaran partly out of the water to reduce drag and increase speed to peaks of over 40 knots; Lisa Blair's boat has none of these. You might think Blair's is a bad boat, others would say it's a completely different boat and so your argument about round-Antarctica times falls.

The race around Antarctica happened in 2008, but does not appear to have happened since. If you know of hard data about more recent Antarctic Cup yacht races, I'd really like to know, I enjoy keeping up with these kind of events.

Finally, for anyone who is interested in sailing closer to the Antarctic ice and the weather and winds encountered, here's an account of Katharsis II skippered by Mariusz Koper, which holds the record for a yacht sailing around Antarctica below 62 deg S latitude. The anomalous winds feature prominently.

https://www.yachtingworld.com/voyages/sailing-antarctica-record-breaking-voyage-around-southern-continent-123341

20

I looked at your map. The only winds not traveling in the same easterly direction are those eddys forming close to land she wasn't sailing in those areas.

It is bizarre to provide your source as some kind of counter.


A source for her route? 

You realise of course that this is a live map, not instantaneous indications of the wind at the time she was in each area.  At the latitudes between 45S and Antarctica the general trend is westerly (ie blowing towards the east), but there are significant times when the wind varies considerably, from all points of the compass.  Do you think that those times and "eddies" don't count?  To claim that "winds on the inside of the ice ring always travel the same way" is complete fantasy. 

But don't take my word; this from her blog Day 79:

"Hi All,
 
 Last night I finally managed to get to bed by around 3am and by 4am the winds had started to veer from the SW to the W before shifting to the NW and build in strength.  I needed to put a gybe in, but I decided to wait until first light to make it a little easier
". 

You'll know of course that a gybe is a similar manouver to a tack, but performed before the wind, so more hazardous.
She ventured a little off course in that instance, I suspect, but as I stated earlier, she was traveling with the wind.

Like I wrote, it is indeed bizarre you would provide a map that does not show an Ice Ring and only shows those eddys that are blowing to the W. She was probably caught up in one  of those.

For information, Lisa Blair's course around Antarctica, as shown on her own site https://lisablairsailstheworld.com/antarctica-2   Both her first attempt in 2017 and the record in 2022 are shown. The 2017 course is particularly interesting for one that doesn't keep to a fairly uniform easterly track.

This also handily shows why round-the-world record attempts have a limit in the latitude south permitted since the globe distance around Antarctica is notably shorter at 60 deg S compared to 45 deg S.

Pages: [1] 2 3 ... 12  Next >